1
2
3
4
5
6
7
8
9
10
11
12
13
14
15
16
17
18
19
20
21
22
23
24
25
26
27
28
29
30
31
32
33
34
35
36
37
38
39
40
41
42
43
44
45
46
47
48
49
50
51
52
53
54
55
56
57
58
59
60
61
| import matplotlib.pyplot as plt
import random
from random import seed
from statistics import *
from scipy.stats import norm
def z_n_calc(n):
root_n = pow(n, 0.5)
seed()
num_array = [random.uniform(0,1) for _ in range(n)]
expectation = sum(num_array)/n
stdeviation = stdev(num_array)
res = 0
for i in range(0, n):
res = res + (num_array[i]-expectation)/(stdeviation*root_n)
return res
def sample_generator(n):
return [z_n_calc(n) for _ in range(10000)]
def norm_cdf_generator(array_in):
return [norm.cdf(x) for x in array_in]
y_array = [x/10000.0 for x in range(10000)]
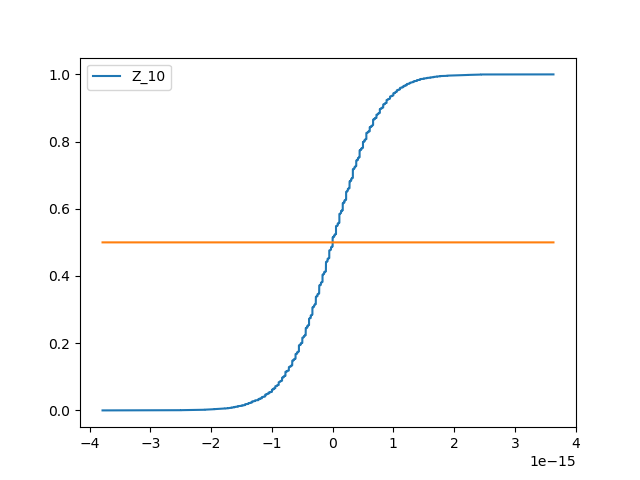
x_array_10 = sorted(sample_generator(10))
plt.figure()
plt.plot(x_array_10, y_array, label='Z_10')
plt.plot(x_array_10, norm_cdf_generator(x_array_10))
plt.legend()
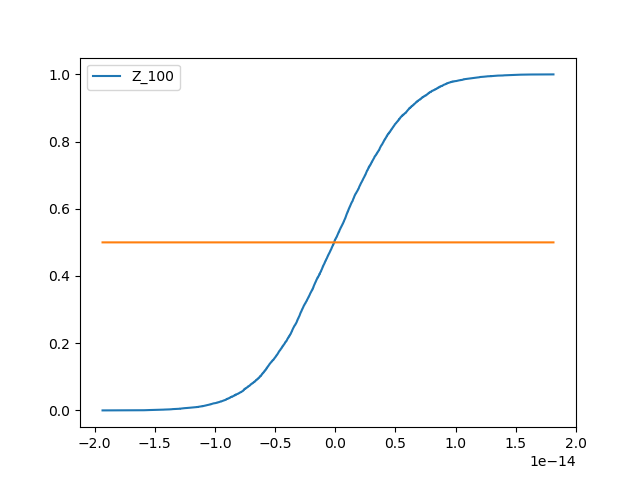
x_array_100 = sorted(sample_generator(100))
plt.figure()
plt.plot(x_array_100, y_array, label='Z_100')
plt.plot(x_array_100, norm_cdf_generator(x_array_100))
plt.legend()
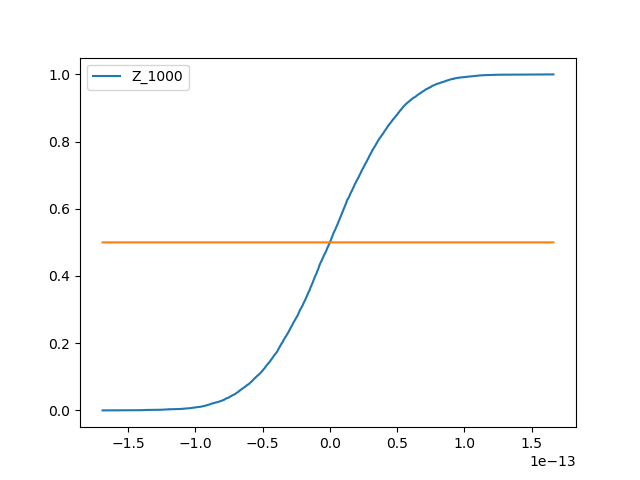
x_array_1000 = sorted(sample_generator(1000))
plt.figure()
plt.plot(x_array_1000, y_array, label='Z_1000')
plt.plot(x_array_1000, norm_cdf_generator(x_array_1000))
plt.legend()
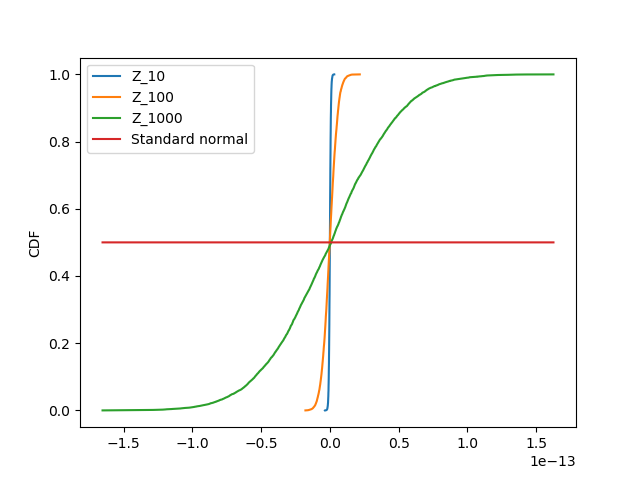
plt.figure()
plt.plot(x_array_10, y_array, label='Z_10')
plt.plot(x_array_100, y_array, label='Z_100')
plt.plot(x_array_1000, y_array, label='Z_1000')
plt.plot(x_array_1000, norm_cdf_generator(x_array_10), label='Standard normal')
plt.legend()
plt.ylabel('CDF')
plt.show()
|